Size of semiconductor acquisitions may have hit limit

Release time:2018-08-15
author:Ameya360
source:IC Insights
reading:1241

The demise of Qualcomm’s pending $44 billion purchase of NXP Semiconductors in late July along with growing regulatory reviews of chip merger agreements, efforts by countries to protect domestic technology, and the escalation of global trade friction all suggest semiconductor acquisitions are hitting a ceiling in the size of doable deals.  It is becoming less likely that semiconductor acquisitions over $40 billion can be completed or even attempted in the current geopolitical environment and brewing battles over global trade.

IC Insights believes a combination of factors—including the growing high dollar value of major chip merger agreements, complexities in combining large businesses together, and greater scrutiny of governments protecting their domestic base of suppliers—will stifle ever-larger mega-transactions in the semiconductor industry in the foreseeable future.  Figure 1 ranks the 10 largest semiconductor merger and acquisition announcements and underscores the growth in size of these M&A transactions.  Eight of the 10 largest announcements occurred in the last three years with only the biggest deal (Qualcomm buying NXP) failing to be completed.

It is important to note that IC Insights’ M&A list only covers semiconductor suppliers, chipmakers, and providers of integrated circuit intellectual property (IP) and excludes acquisitions of software and system-level businesses by IC companies  (such as Intel’s $15.3 billion purchase of Mobileye, an Israeli-based developer of digital imaging technology for autonomous vehicles, in August 2017).  This M&A list also excludes transactions involving semiconductor capital equipment suppliers, material producers, chip packaging and testing companies, and design automation software firms.

Qualcomm’s $44 billion cash purchase of NXP would have been the largest semiconductor acquisition ever if it was completed, but the deal—originally announced in October 2016 at nearly $39 billion and raised to $44 billion in February 2018—was canceled in the last week of July because China had not cleared the transaction.  China was the last country needed for an approval of the merger, and it was believed to be close to clearing the purchase in 2Q18, but growing threats of tariffs in a brewing trade war with the U.S. and moves to block Chinese acquisitions of American IC companies caused China to taken no action on the $44 billion acquisition in time for a deadline set by Qualcomm and NXP.  U.S.-based Qualcomm canceled the acquisition on July 26 and quickly paid NXP in the Netherlands a $2 billion breakup fee so the two companies could move on separately.

Prior to Qualcomm’s failed $44 billion offer for NXP, the largest semiconductor acquisition was Avago Technologies’ $37 billion cash and stock purchase of Broadcom in early 2016.  Avago renamed itself Broadcom Limited after the purchase and launched a failed $121 billion hostile takeover bid for Qualcomm at the end of 2017.  It lowered the unsolicited bid to $117 billion in February 2018 after Qualcomm raised its offer for NXP to $44 billion.  In March 2018, U.S. President Donald Trump blocked Broadcom’s $117 billion takeover bid for Qualcomm after concerns were raised in the U.S. government about the potential loss of cellular technology leadership to Chinese companies, if the hostile acquisition was completed. After the presidential order, Broadcom executives said the company was considering other acquisition targets, with cash, that would be smaller and more focused.

The global semiconductor industry has been reshaped by a historic wave of mergers and acquisitions during the past three years, with about 100 M&A agreements being reached between 2015 and the middle of 2018 with the combined value of these transactions being more than $245 billion, based on data collected by IC Insights and contained within its Strategic Reviews database subscription service and in The 2018 McClean Report on the IC Industry.  A record-high $107.3 billion in semiconductor acquisition agreements were announced in 2015.  The second highest total for semiconductor M&A agreements was then reached in 2016 at $99.8 billion.  

Semiconductor acquisition announcements reached a total value of $28.3 billion in 2017, which was twice the industry’s annual average of about $12.6 billion in the first half of this decade but significantly less than 2015 and 2016, when M&A was sweeping through the chip industry at historic levels.  In the first six months of 2018, semiconductor acquisition announcements had a total value of about $9.6 billion, based on IC Insights’ running tally of announced M&A deals.

("Note: The information presented in this article is gathered from the internet and is provided as a reference for educational purposes. It does not signify the endorsement or standpoint of our website. If you find any content that violates copyright or intellectual property rights, please inform us for prompt removal.")

Online messageinquiry

reading
Revenue Growth in China's Semiconductor Industry Would Slow Down to 16.2% in 2019 due to Pessimistic
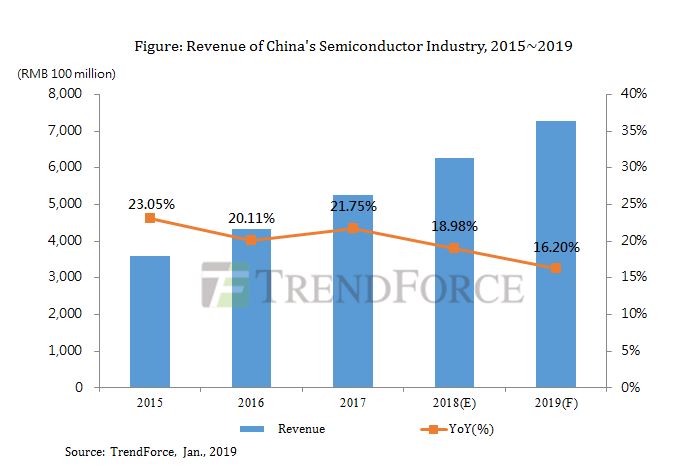
  According to the latest report by TrendForce - Breakdown Analysis of China’s Semiconductor Industry, the outlook for China’s semiconductor industry has been tampered since the second half of 2018 due to pessimistic economy worldwide and uncertainties brought by the China-U.S. trade war, although the industry managed to reach a total revenue of over 600 billion RMB in 2018. Looking ahead to 2019, the revenue of China's semiconductor industry is expected to reach RMB 729.8 billion, but the annual growth rate would slow down to 16.20%, the lowest in the past five years.  According to Jeter Teo, Research Director at TrendForce, there would be several challenges for China's semiconductor industry in the coming year, including the global economic slowdown, the overall weak demand, the negative growth in global smartphone production volume, as well as the continued trade conflicts between China and the United States.  However, as the Chinese government continues to seek self-sufficiency of chips and aims at reducing its dependence on foreign companies, the domestic semiconductor industry will keep growing. On the other hand, new applications will trigger increasing demand for semiconductors, driven by emerging technologies like AI, 5G, autonomous driving, electric vehicles, CIS, biometric recognition, Internet of Things, and edge computing.  It is worth noting that, recent years have seen the rise of China's domestic IC design industry, which has played a key role in leading the development of China's semiconductor industry. The industrial structure has continued to be optimized as well. For 2019, the sector of IC design is expected to account for 40.62% of China's semiconductor industry, while IC manufacturing would account for 28.68%, IC testing and packaging would take about 30.7%.  On the other hand, TrendForce’s data show that key sectors of the semiconductor industry are expected to register continued growth in revenue, with the growth rate of IC manufacturing reaching 18.58%, higher than 17.86% of IC design and 12% of IC testing and packaging. More than 10 new fabs for 12-inch wafer will enter production in China in 2019, while some 8-inch wafer fabs and the power semiconductor sector anticipate production expansion.
2019-01-25 00:00 reading:4308
Demand for xEV Batteries Grow Steadily, but Chinese xEV Battery Market Faces Reshuffle as Subsidies Phase Out
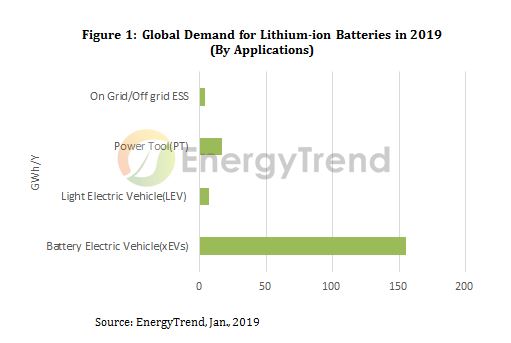
  According to the latest research by EnergyTrend, a division of TrendForce, the market of new energy vehicle will continue to grow steadily, driving the demand for xEV batteries, despite the slowdown in global automotive market since 2018. The global demand for lithium-ion batteries used in new energy passenger cars is estimated to reach 155GWh in 2019, a growth of 63% from 95GWh in 2018.  According to Duff Lu, senior research manager of EnergyTrend, China has become the world's fastest-growing market for new energy vehicles driven by the government’s subsidies and supporting policies. After a rapid growth in 1H18, the shipments of new energy cars in China slowed down in 2H18, moderating the demand in the xEV battery industry as well. However, with increasing penetration of new energy vehicles, the demand for lithium-ion batteries used in new energy passenger cars in China will grow to 54GWh in 2019, a growth of nearly 80% from 30GWh in 2018.  In terms of supply, the production capacity of xEV battery in China has surpassed 134GWh by the end of 2018, and has a chance to reach 164GWh in 2019. Amid the oversupply and phasing out of subsidies from the Chinese government, the industry has been faced with a reshuffle since the second half of 2018. Major manufacturers have grown stronger at the expense of the demise of smaller companies. Leading players like Contemporary Amperex Technology (CATL) and BYD continue to expand, while less competitive ones who rely too much on regional markets, such as OptimumNano Energy, may have to exit the market during the market reshuffle.  EnergyTrend expects that, with new capacity entering operation in 2019, the xEV battery industry will become more concentrated. The top five battery manufacturers would continue to grow and become the major suppliers. Subsidies from the Chinese government will be phased out by 2020, but before that, the industry will still depend on the subsidies to cover their R&D costs for advanced battery technologies. Manufacturers need to continue the development of high energy density solutions, building up competitiveness, before the electric vehicle market enters the maturity stage.
2019-01-25 00:00 reading:4765
Semiconductor Unit Shipments Exceeded 1 Trillion Devices in 2018
  Semiconductor units forecast to increase 7% in 2019 with IC units rising 8%, O-S-D units growing 7%.  Annual semiconductor unit shipments, including integrated circuits and optoelectronics, sensors, and discrete (O-S-D) devices grew 10% in 2018 and surpassed the one trillion unit mark for the first time, based on data presented in the new, 2019 edition of IC Insights’ McClean Report—A Complete Analysis and Forecast of the Integrated Circuit Industry. As shown in Figure 1, semiconductor unit shipments climbed to 1,068.2 billion units in 2018 and are expected to climb to 1,142.6 billion in 2019, which equates to 7% growth for the year.  Starting in 1978 with 32.6 billion units and going through 2019, the compound annual growth rate for semiconductor units is forecast to be 9.1%, a very impressive growth figure over 40 years, given the cyclical and often volatile nature of the semiconductor industry.Figure 1  Over the span of just four years (2004-2007), semiconductor shipments broke through the 400-, 500-, and 600-billion unit levels before the global financial meltdown caused a big decline in semiconductor unit shipments in 2008 and 2009.  Unit growth rebounded sharply with 25% growth in 2010, which saw semiconductor shipments surpass 700 billion devices. Another strong increase in 2017 (12% growth) lifted semiconductor unit shipments beyond the 900-billion level before the one trillion mark was achieved in 2018.  The largest annual increase in semiconductor unit growth during the timespan shown was 34% in 1984, and the biggest decline was 19% in 2001 following the dot-com bust.  The global financial meltdown and ensuing recession caused semiconductor shipments to fall in both 2008 and 2009; the only time that the industry experienced consecutive years in which unit shipments declined.  The 25% increase in 2010 was the second-highest growth rate across the time span.  The percentage split of total semiconductor shipments is forecast to remain heavily weighted toward O-S-D devices in 2019 (Figure 2).  O-S-D devices are forecast to account for 70% of total semiconductor units compared to 30% for ICs.  This percentage split has remained fairly steady over the years.  In 1980, O-S-D devices accounted for 78% of semiconductor units and ICs represented 22%.  Many of the semiconductor categories forecast to have the strongest unit growth rates in 2019 are those that are essential building-blocks for smartphones, automotive electronics systems, and devices that are used in computing systems essential to artificial intelligence, “big data,” and deep learning applications.Figure 2
2019-01-24 00:00 reading:4219
Despite concern, large TFT LCD panel shipments increase
  Global shipments of large thin-film transistor (TFT) liquid crystal display (LCD) panels rose again in 2018 despite concerns of over-supply in the market. In particular, area shipments increased by 10.6 percent to 197.9 million square metres compared to the previous year, driven by TV and monitor panels, according to IHS Markit.  Fierce price competition in large 65 and 75-inch display panels was ignited as Chinese panel maker BOE started the mass production of the panels in 2018 at its B9 10.5-generation facility. “With BOE operating the 10.5-generation line, panel makers have become more aggressive on pricing since early 2018 to digest their capacity,” said Robin Wu, principal analyst at IHS. “Large panels are still more profitable than smaller ones.”  Rising demand for gaming-PC and professional-purpose monitors boosted shipments of high-end, large panels. “Some panel makers have allocated more monitor panels to the fab, replacing existing TV panels, to make up for poor performance of that business,” Wu said.  Demand for other applications, which include public, automotive and industrial displays, recorded the highest growth rates of 17.5 percent by area and 28.6 percent by unit. “Panel makers view these applications as a new cash cow that can compensate for the sharp price erosion in main panels for TVs, monitors and notebook PCs,” Wu said.  LG Display led the area shipments of large display panels, with a 21 percent share in 2018, followed by BOE (17 percent) and Samsung Display (16 percent). BOE boasted the largest unit-shipment share of 23 percent, followed by LG Display (20 percent) and Innolux (17 percent), according to the Large Area Display Market Tracker by IHS Markit.  Large TFT LCD panel shipment growth is expected to continue in 2019. The preliminary forecast for unit shipments of three major products indicates that panel makers will continue to focus on the monitor and notebook PC panel businesses, increasing shipments by 5.3 percent and 6.6 percent, respectively, over the year, while shipments of TV panels are forecast to grow just 2.6 percent.  In 2019, three new 10.5-generation fabs – ChinaStar’s T6, BOE’s second fab and Foxconn/Sharp’s Guangzhou line – are expected to start mass production. All of them are assigned to manufacture TV panels, further boosting TV panel supply. “As the TV panel business is predicted to remain tough, panel makers, who enjoyed relatively better outcomes with monitor and notebook PC panels in 2018, will likely focus on the IT panel businesses,” Wu said.
2019-01-24 00:00 reading:1999
  • Week of hot material
  • Material in short supply seckilling
model brand Quote
TL431ACLPR Texas Instruments
RB751G-40T2R ROHM Semiconductor
CDZVT2R20B ROHM Semiconductor
BD71847AMWV-E2 ROHM Semiconductor
MC33074DR2G onsemi
model brand To snap up
ESR03EZPJ151 ROHM Semiconductor
IPZ40N04S5L4R8ATMA1 Infineon Technologies
STM32F429IGT6 STMicroelectronics
BP3621 ROHM Semiconductor
BU33JA2MNVX-CTL ROHM Semiconductor
TPS63050YFFR Texas Instruments
Hot labels
ROHM
IC
Averlogic
Intel
Samsung
IoT
AI
Sensor
Chip
About us

Qr code of ameya360 official account

Identify TWO-DIMENSIONAL code, you can pay attention to

AMEYA360 weixin Service Account AMEYA360 weixin Service Account
AMEYA360 mall (www.ameya360.com) was launched in 2011. Now there are more than 3,500 high-quality suppliers, including 6 million product model data, and more than 1 million component stocks for purchase. Products cover MCU+ memory + power chip +IGBT+MOS tube + op amp + RF Bluetooth + sensor + resistor capacitance inductor + connector and other fields. main business of platform covers spot sales of electronic components, BOM distribution and product supporting materials, providing one-stop purchasing and sales services for our customers.

Please enter the verification code in the image below:
verification code